The existing Demand Planning suite does not consistently reflect how users make decisions in real operational contexts, resulting in inefficiencies, fragmented workflows, and reliance on manual workarounds. This gap reduces confidence in the system and increases the risk of error, highlighting the need for deeper understanding of real-world usage to inform experience and product decisions that are both relevant and scalable.
Project Overview
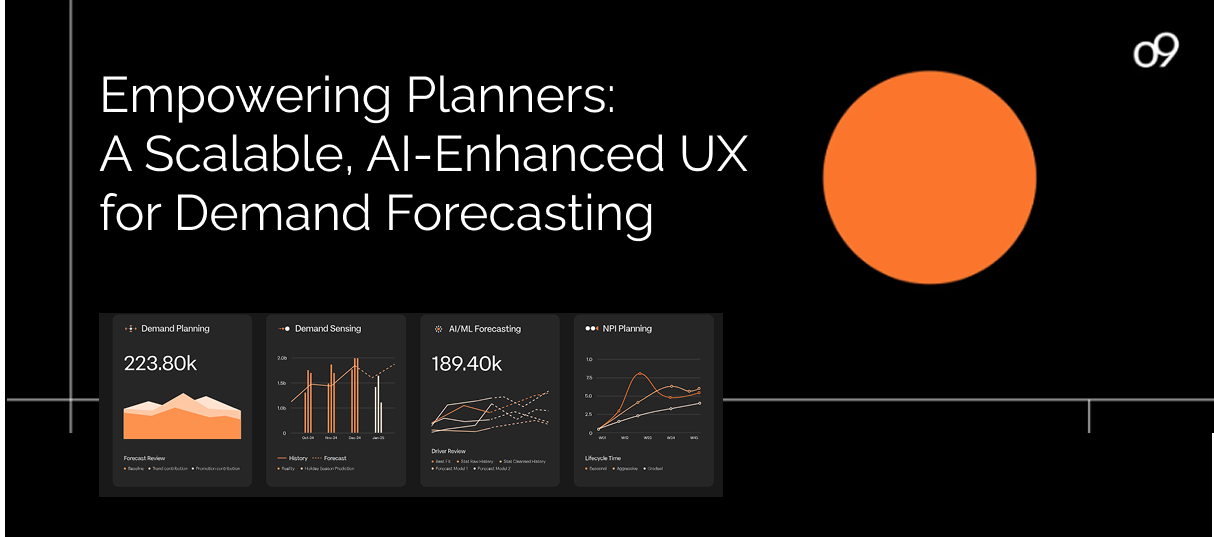
Defined and operationalised the experience strategy for an enterprise, data-intensive Demand Planning platform, aligning customer workflows, system behaviour, and delivery governance to reduce decision friction, improve confidence, and support business-critical outcomes at scale.
- Role - Experience Strategy & Governance, User Research Leadership, Hands-on UX Design Direction
- Duration - 6-week discovery and strategic definition phase
- Team - Experience Lead (Janto Jose), supported by 1 UX Researcher and 1 UX Designer, working closely with Product and Engineering leadership
Approach
The approach centred on early-stage discovery, executive alignment, and evidence-based decision-making to shape experience strategy, prioritisation, and downstream delivery across a complex product ecosystem. This included:
- User Interviews - to uncover real-world workflows, decision-making patterns, and areas of user uncertainty or risk
- Stakeholder Interviews - to align experience direction with business priorities, technical realities, and delivery constraints
- Contextual Studies - to observe how users navigate complex systems in live operational settings and critical decision moments
- Competitor Analysis - to assess experience maturity, identify industry benchmarks, and highlight opportunities for differentiation
- Outcome – to define a clear, scalable experience direction that improved usability, workflow clarity, and user confidence
- Metrics – to establish measurable success criteria including task efficiency, error reduction, and confidence in key workflows
Research & Discovery
The research approach combined competitor benchmarking, user and stakeholder interviews, and contextual inquiry to build an evidence-based understanding of how the platform supports or hinders real world decision-making.
In-depth conversations with demand planners focused on how they interpret data, manage uncertainty, and make critical decisions in day-to-day operations. The research surfaced recurring challenges, including limited confidence in forecast accuracy, insufficient visibility across upstream and downstream data, and inefficiencies driven by fragmented tools and manual interventions.
Goals
- Increase confidence in forecast accuracy and reliability to support high-quality, data-driven decisions
- Provide end-to-end visibility into trends and dependencies to enable more proactive planning
- Reduce manual effort and operational friction through integrated, intuitive workflows
- Improve collaboration across cross-functional teams by aligning data, context, and decision ownership
- Establish scalable, standardised planning patterns that can adapt across regions and teams
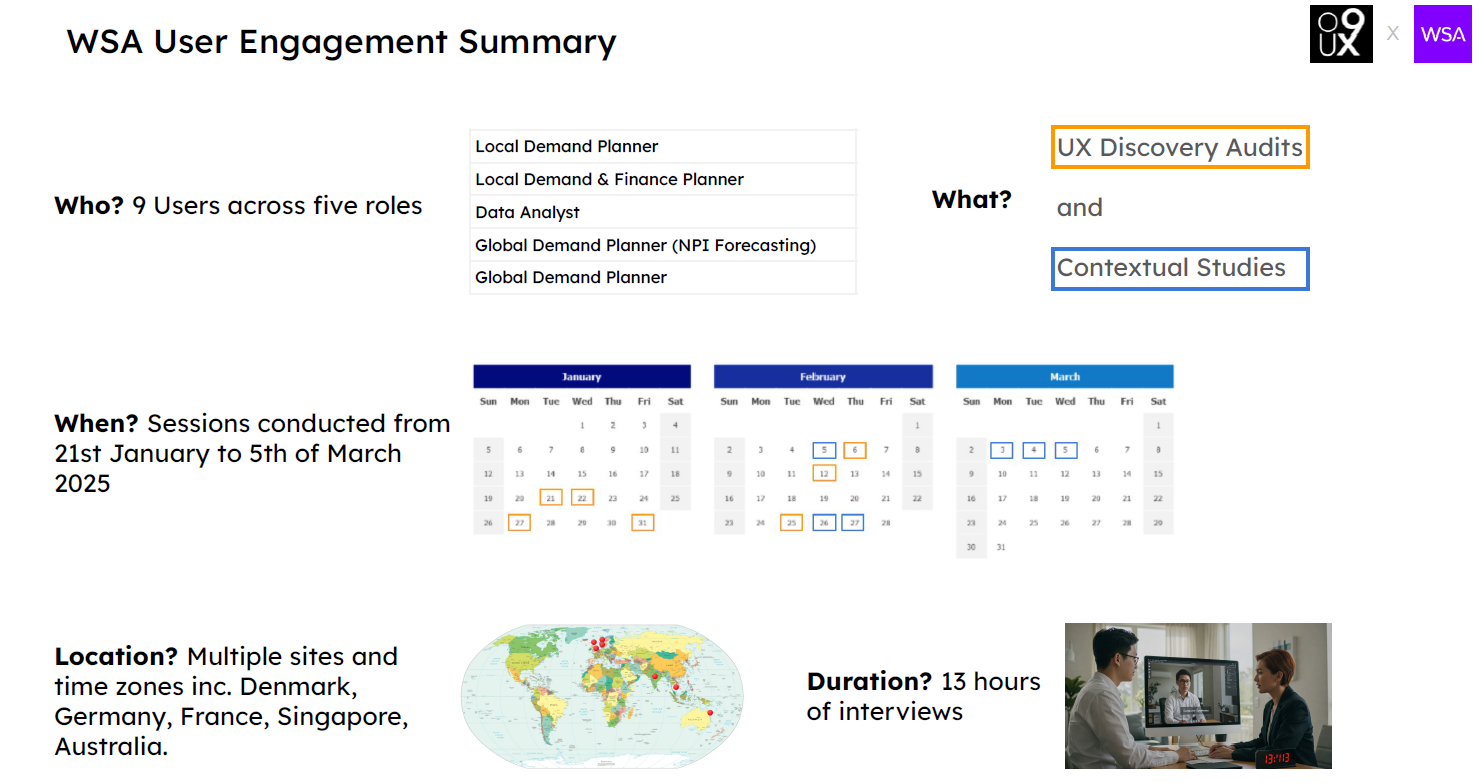
User Interviews
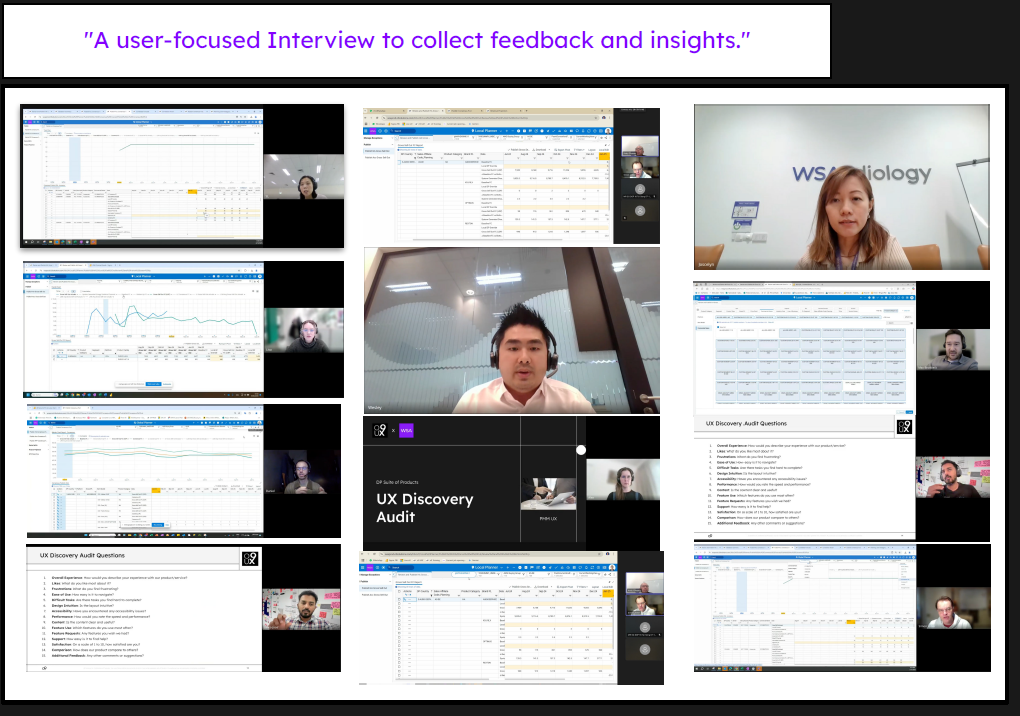
"To gain a deeper understanding of user needs, pain points, and behaviors, we conducted in-depth interviews with a series users involved in the demand planning process."
The goal was to identify usability issues, understand user behaviors, and gather feedback to inform design improvements. We interviewed demand planners and stakeholders to capture diverse perspectives across roles and planning scenarios.
Interveview Questions
- Overall satisfaction and experience
- Usability and navigation
- Frustrations and pain points
- Commonly used features
- Difficult tasks and unmet needs
- Performance and responsiveness
- Suggestions for improvement
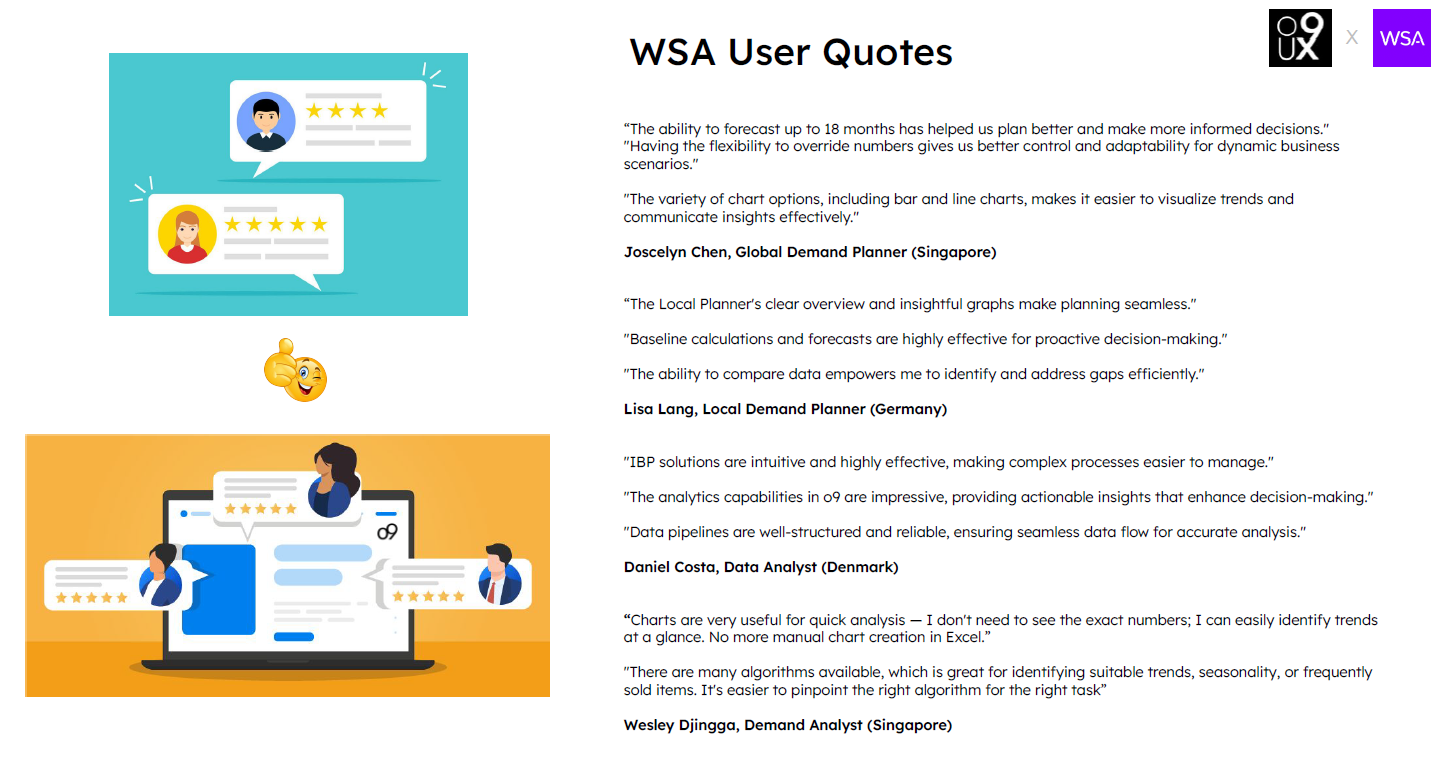
Key Takeaways
- Users struggle with trust in data, especially around forecast accuracy and transparency.
- Collaboration features are underutilized due to lack of visibility and version control.
- The interface feels cluttered and non-intuitive for everyday tasks.
- Insights from these interviews directly shaped our redesign priorities focusing on usability, simplification, and feature accessibility.
Stakeholder Interviews
To ensure our design met both user needs and business objectives, we conducted interviews with three key stakeholders
- Demand Planning Managers (Stat Forecast, Key Account Forecast, NPI) — responsible for forecast accuracy and planner productivity
- IT Lead/Configurators — oversees system integrations and data infrastructure
- Sales Director — focuses on collaboration between sales and planning for better demand visibility
And then Synthesize the most important points from the interviews.
- Forecast Accuracy vs. Planner Efficiency: Need to reduce forecast errors without increasing manual work.
- Data Integration Challenges: Legacy systems create bottlenecks in data flow and real-time updates.
- Collaboration Gaps: Sales and planning teams lack tools for seamless communication, leading to misaligned forecasts.
Stakeholder Insights to Design Decisions
Based on these insights, we prioritized:
- Designing a streamlined interface that reduces planner clicks
- Improving data integration points to minimize manual syncing
- Adding collaborative features like real-time comments and alerts to bridge sales and planning teams
Impact on Design
These insights guided our focus on simplifying the interface to reduce clicks, enhancing data synchronization, and adding collaborative features such as comments and real-time notifications. This approach aimed to address both planner pain points and business priorities, ensuring adoption and measurable impact.
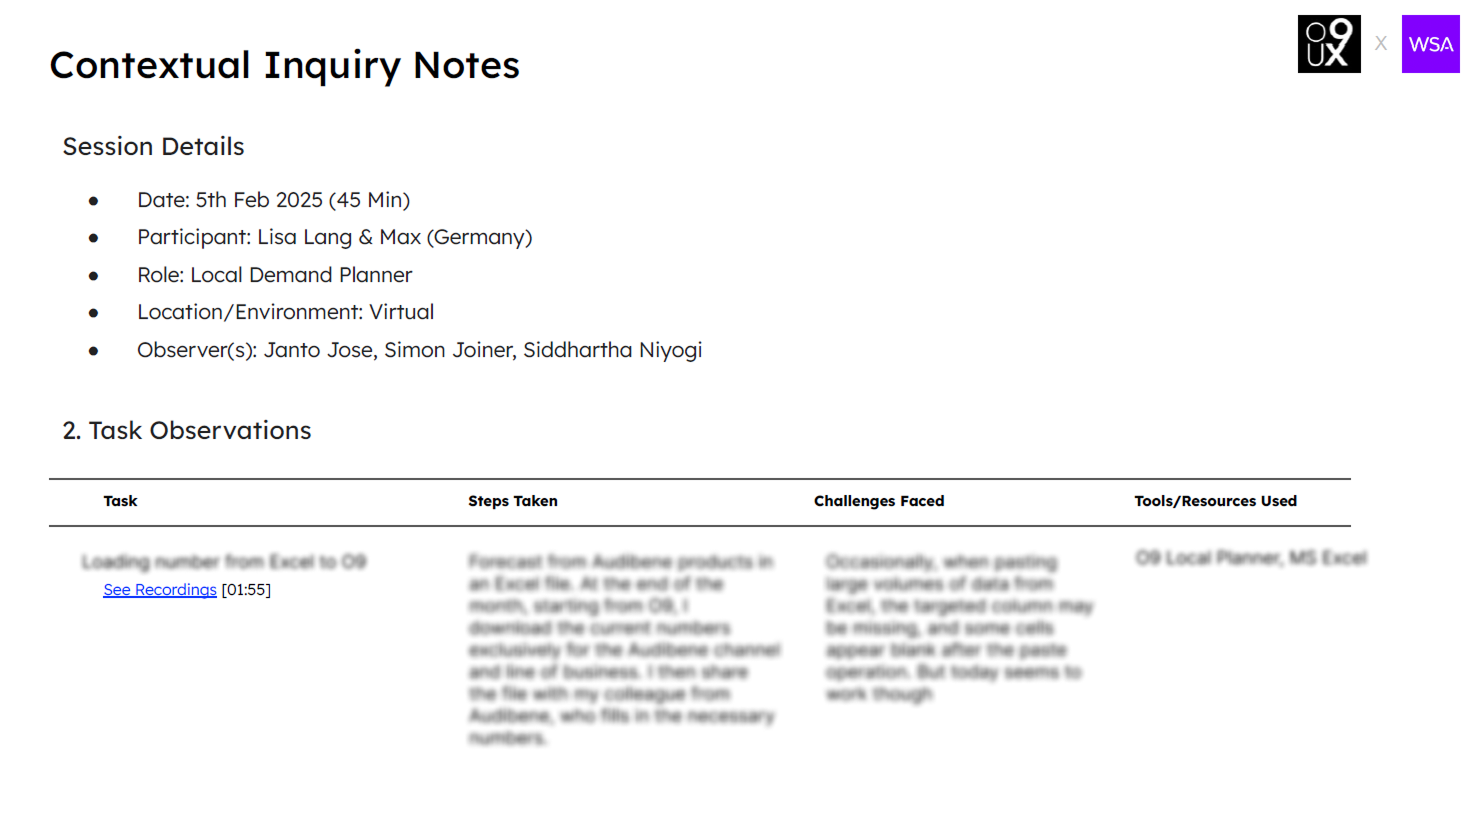
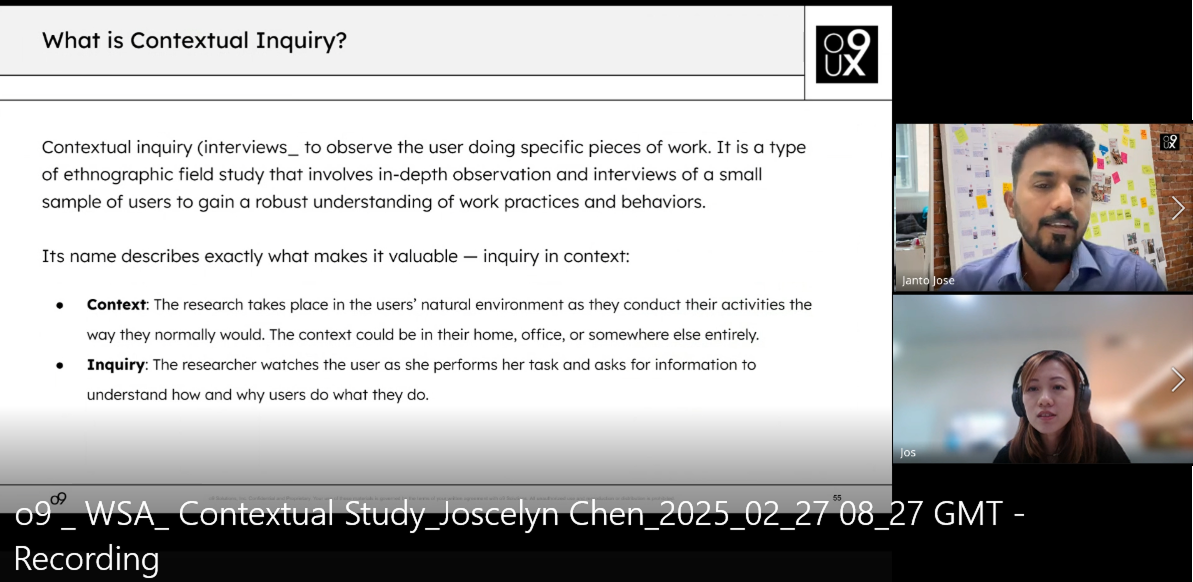
Contextual Studies
During user interviews, we requested participants to share time slots for conducting contextual interviews on the specific days they perform forecasting. This would allow us to observe their work practices and behaviors in real-time.
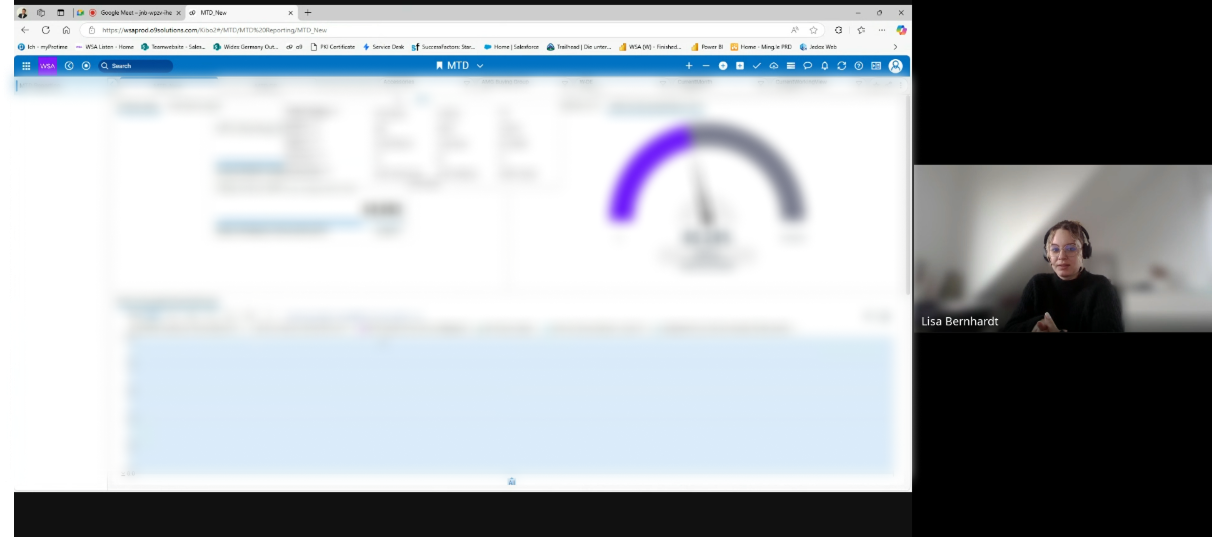
We scheduled contextual inquiry sessions with planners to observe how they use demand planning products in their actual work environment. The goal was to understand the intent behind each touchpoint and interaction, why they performed certain actions, what outcomes they were aiming for, and how the tools supported their workflow.rcations
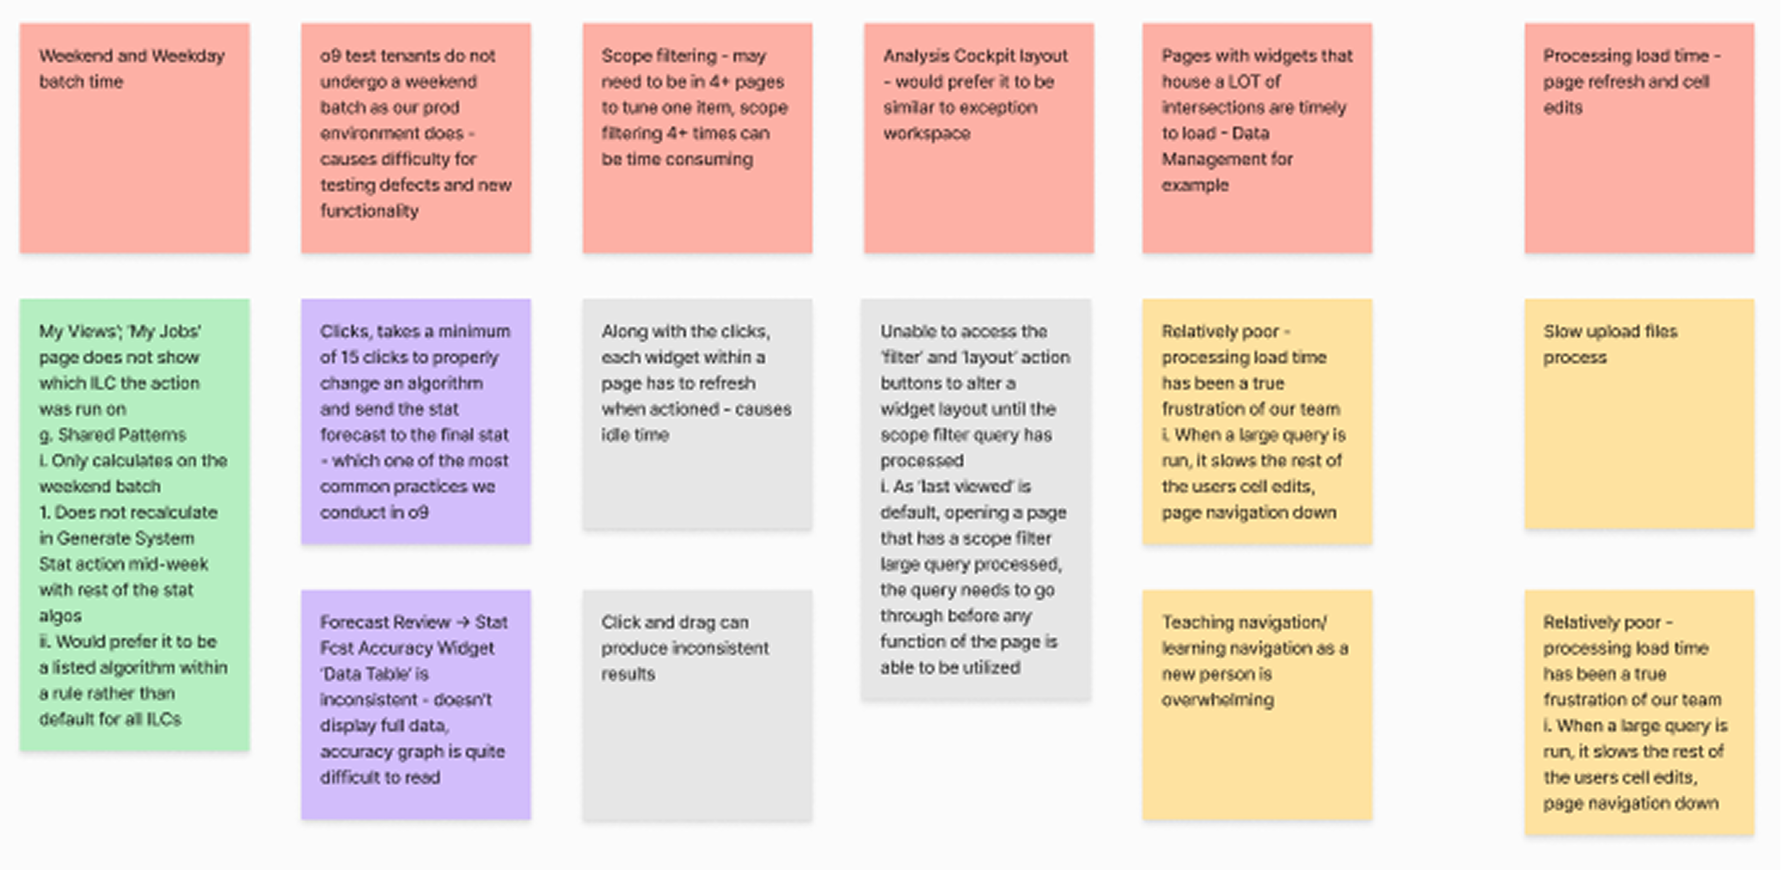
Outcome & Key Takeaways
- Planners use Excel, IBP, and Power BI together, frequently switching between tools to complete tasks.
- Forecast validation and overrides are mostly manual, suggesting potential for AI-driven automation.
- Item master and forecast generation pages suffer from slow performance and laggy global filters.
- Copy-pasting from Excel can lead to data loss, such as blank cells or missing columns.
- Planners rely heavily on Excel for scenario planning, tracking, and handling exceptions.
- Repetitive clicks and complex navigation contribute to user fatigue.
- Lack of integration between systems increases manual effort.
- Limited AI use results in missed opportunities for smarter forecasting and anomaly detection.
- There's a need for smarter alerts, AI suggestions, and proactive insights to aid decision-making.
- Users expressed interest in AI-powered features that adapt to different skill levels and workflows.
Due to NDA constraints, product-specific data has been intentionally blurred.
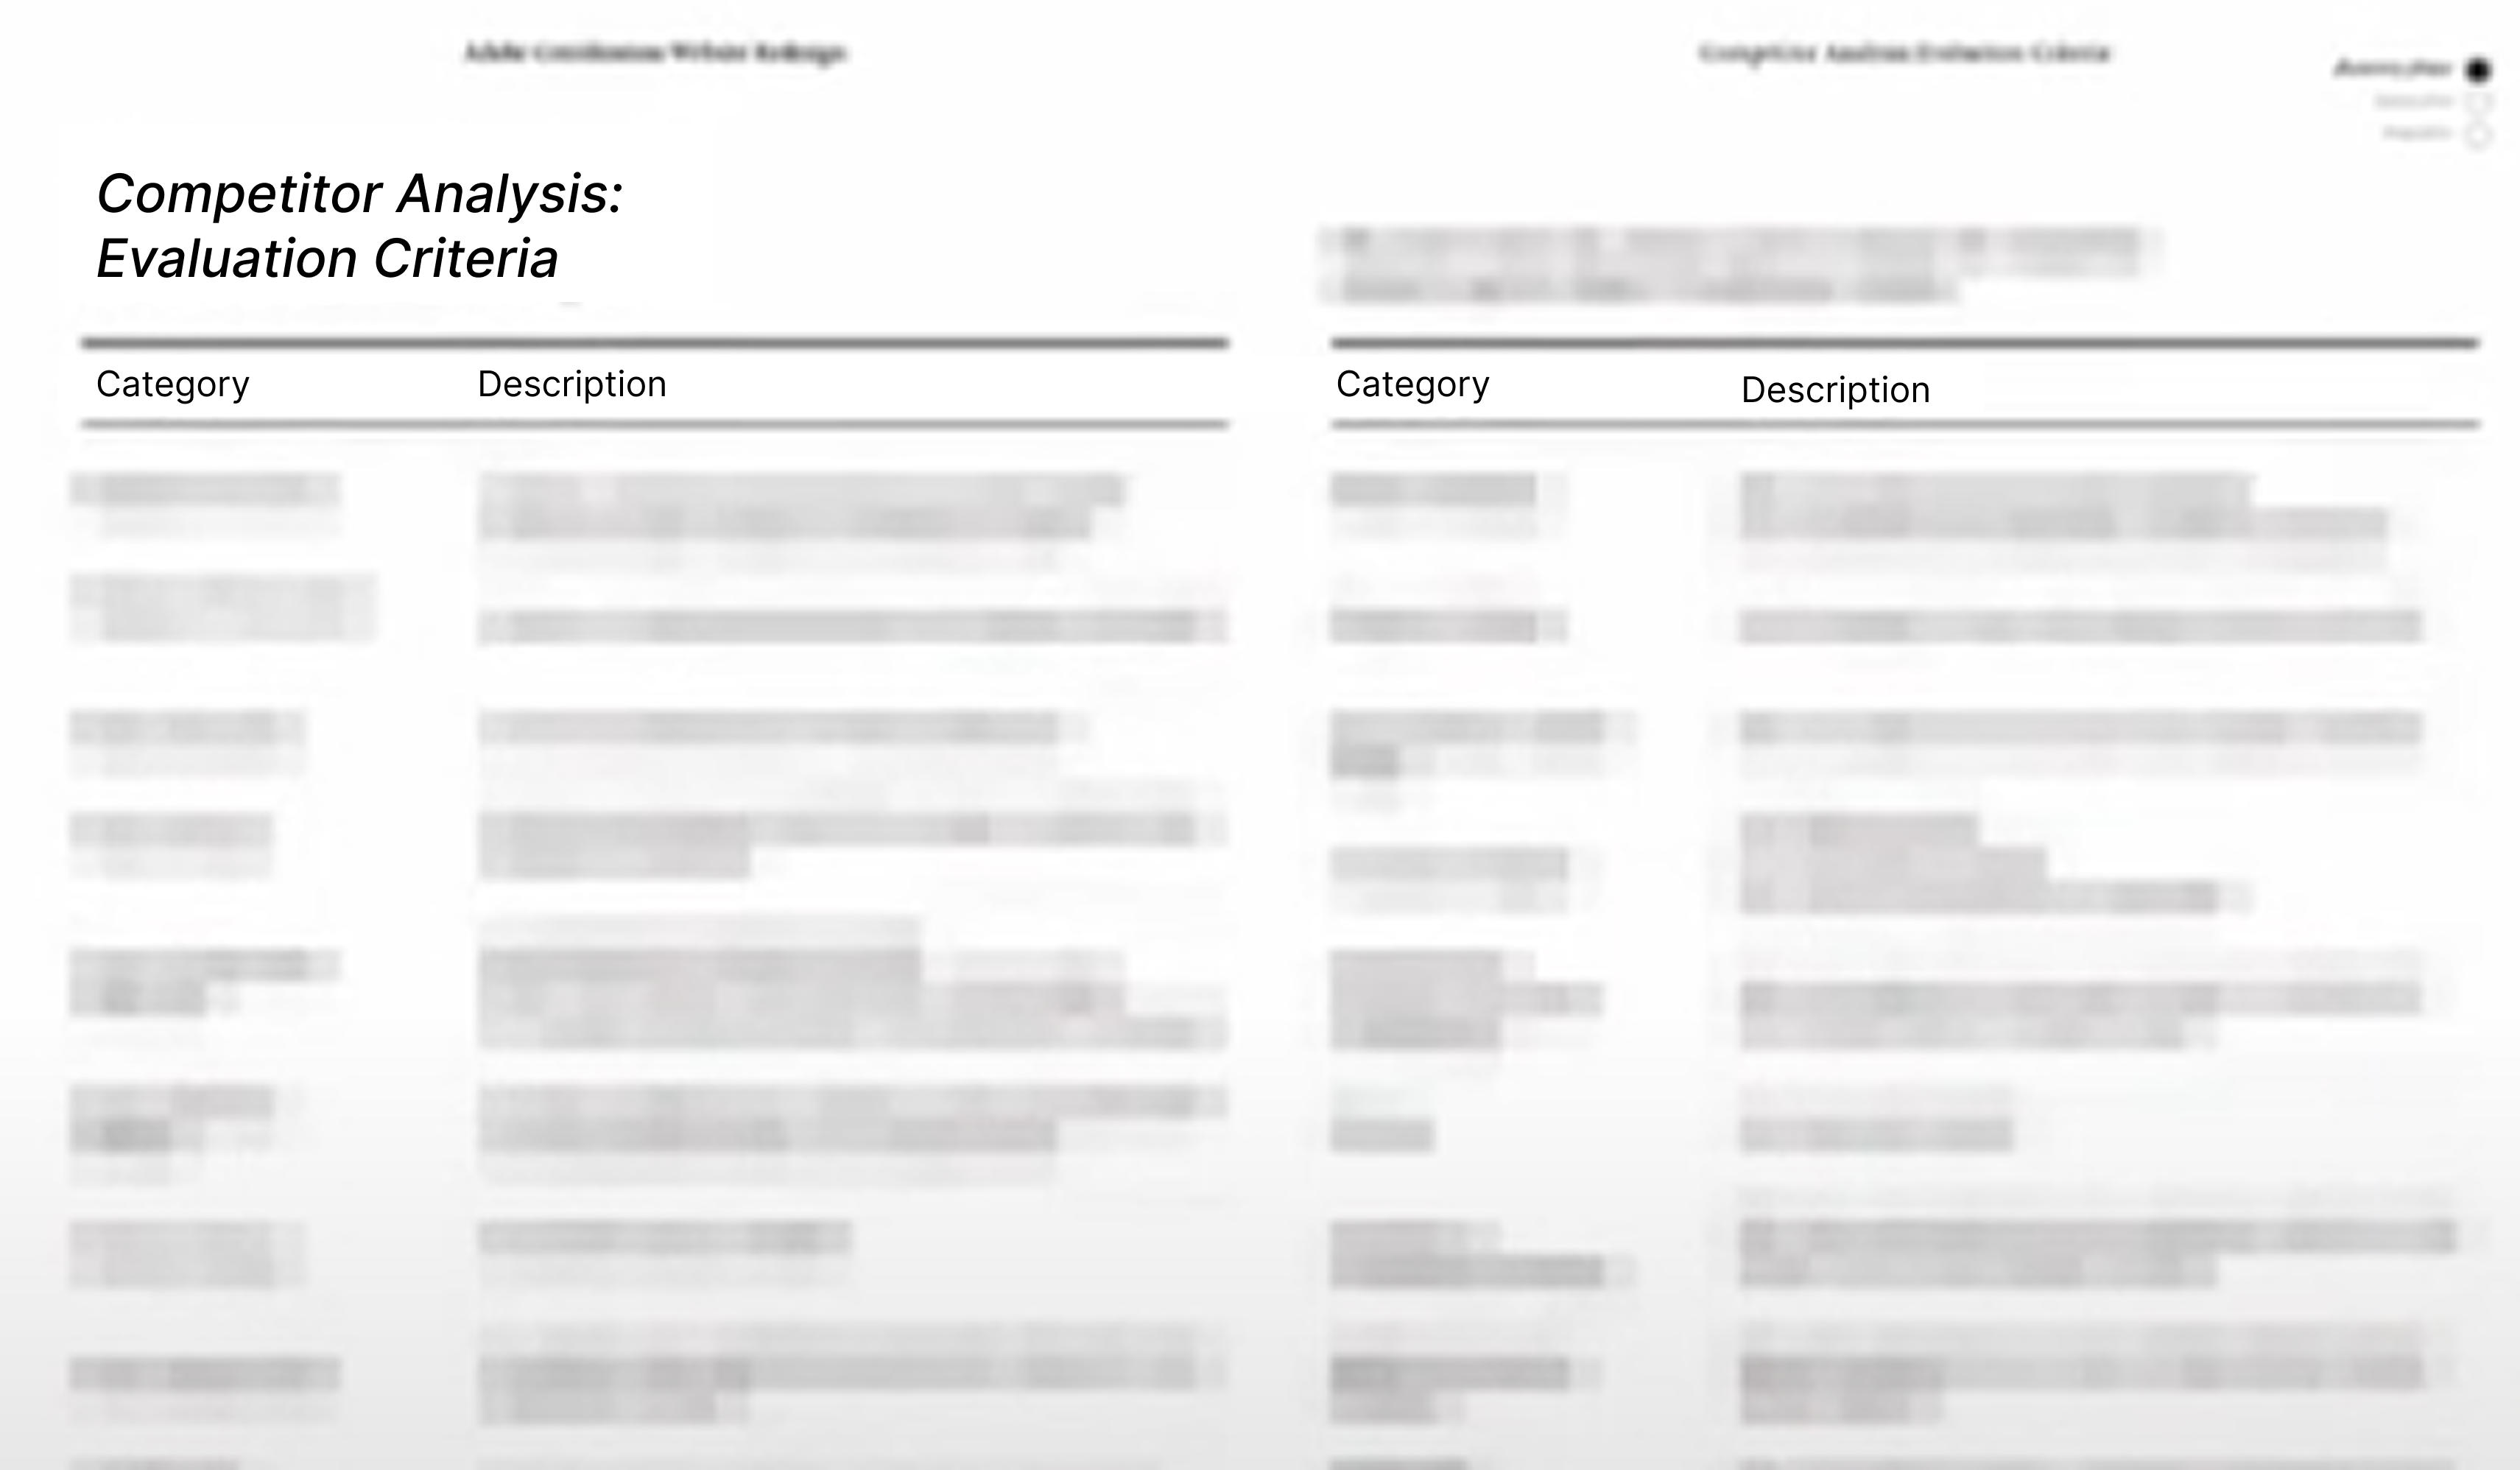
Competitor Analysis
As part of the demand planning product redesign process, We conducted a competitor analysis to understand how other tools in the market address similar user needs, and to identify design patterns, strengths, and gaps that could inform our solution.
Objectives of the Analysis
- Benchmark user experience and feature offerings of leading demand planning tools
- Identify usability strengths and weaknesses
- Highlight opportunities for differentiation
- Understand industry trends and user expectations
Tools Analyzed
- SAP IBP
- Oracle Demand Management Cloud
- Blue Yonder (formerly JDA)
- Kinaxis
Key Insights & Design Opportunities
- Planning tools are powerful but often have complex, non-intuitive interfaces that hinder usability.
- Limited collaboration features lead to inefficiencies and misalignment across teams.
- Users struggle to trace forecast assumptions due to cluttered dashboards and lack of guidance.
- There's a need for simple, flexible, and AI-supported design with real-time collaboration and smarter insights.
Due to NDA constraints, product-specific data has been intentionally blurred.
Synthesis & Recommendations
After gathering user research data through interviews, contextual studies, and competitor analysis, I organized and synthesized the findings to make them actionable.
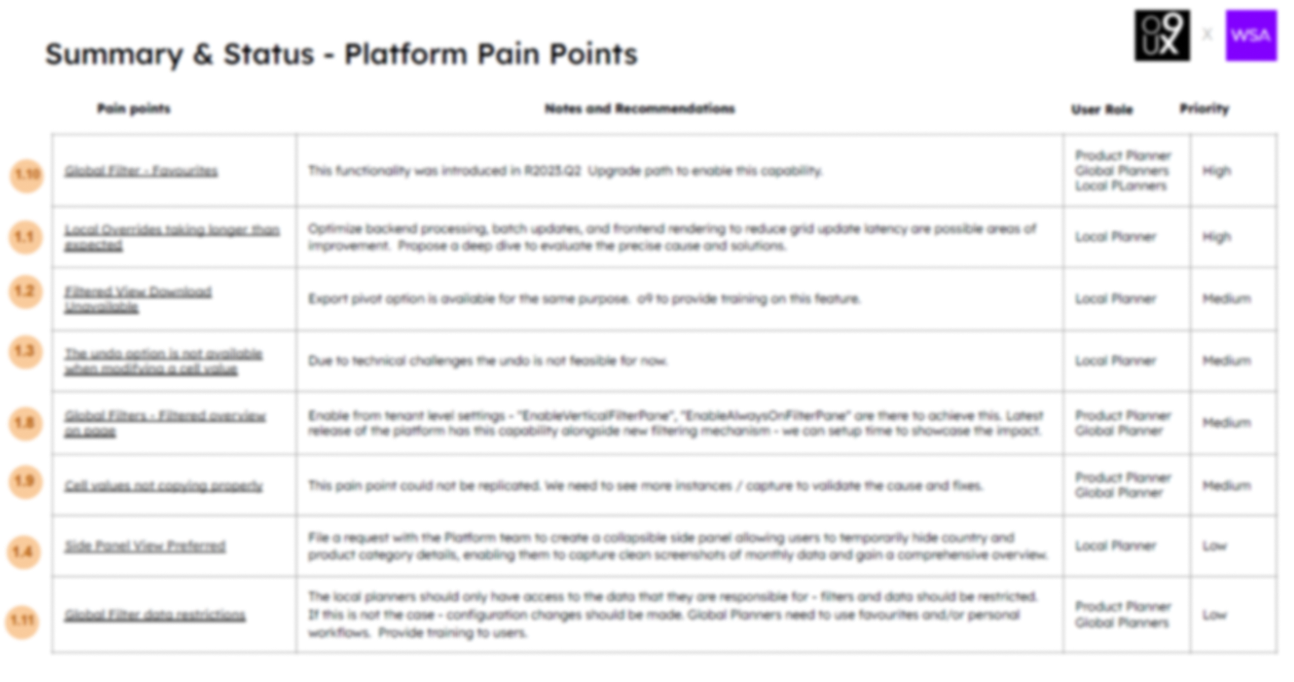
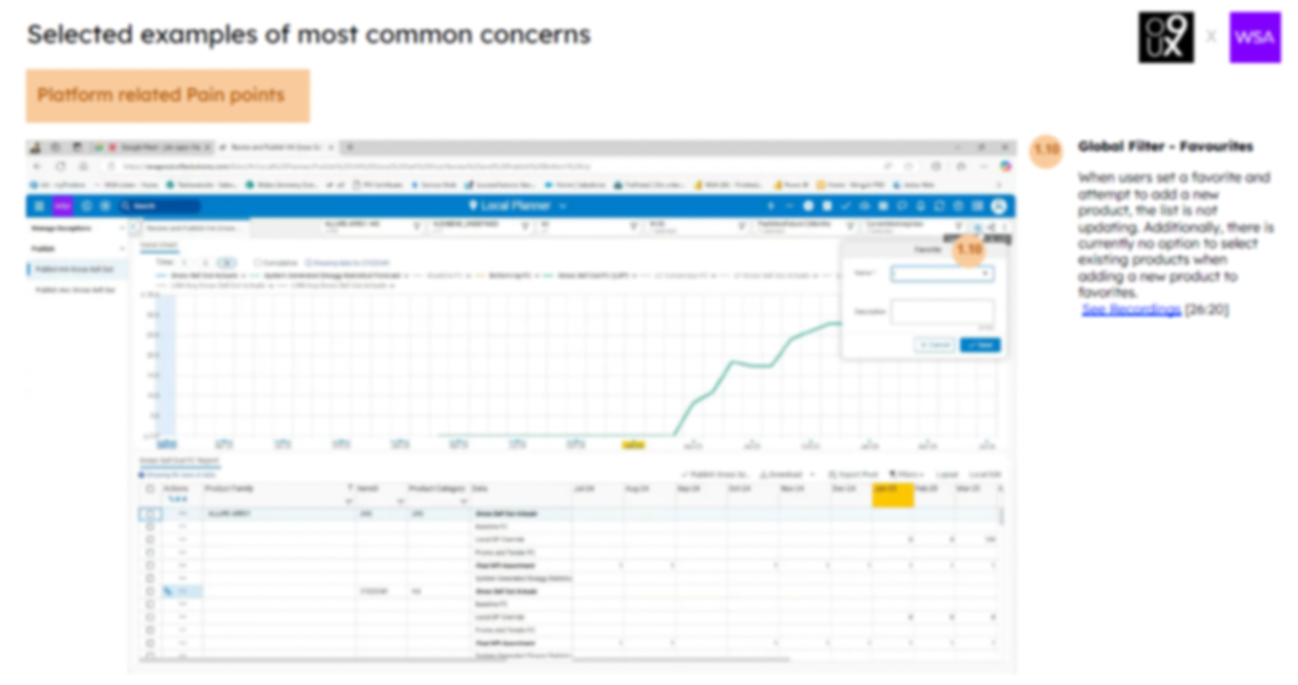
All pain points were categorized into two groups: platform-related and product-related.
Key Takeaways
- Transcribed notes, photos, recordings; grouped feedback via affinity mapping
- Found recurring issues, aligned frustrations with business or operational gaps
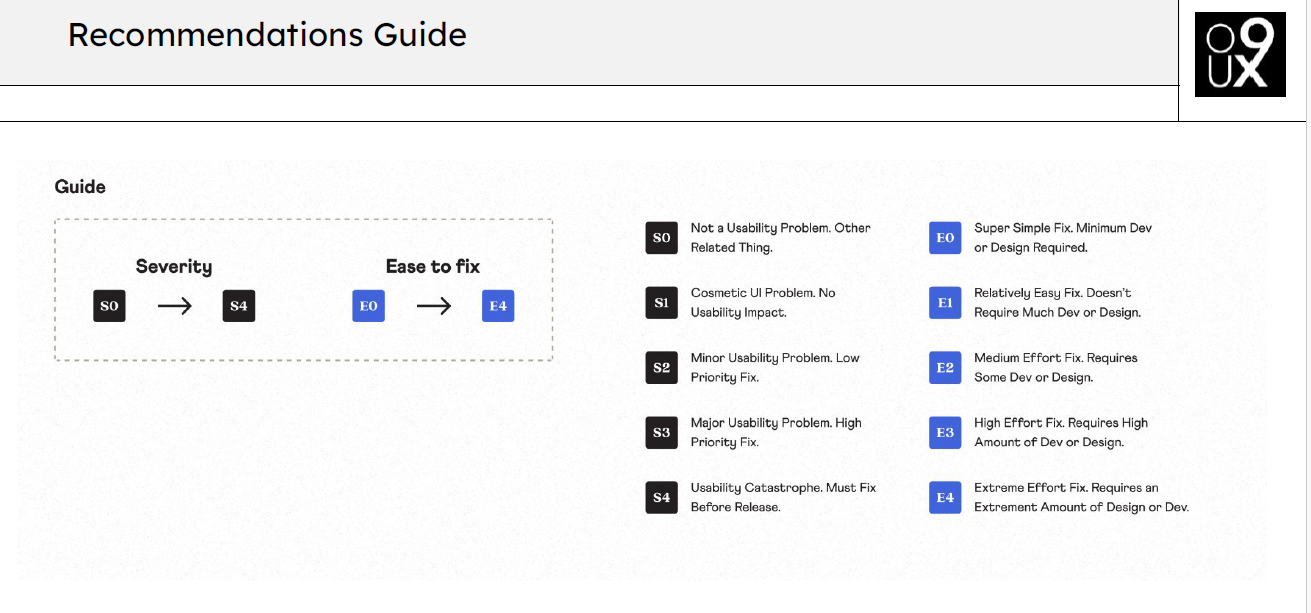
- Rated pain points by impact & frequency; flagged quick wins vs. long-term fixes as priority
- Framed problem statements and tied them to design recommendations
Recommendations
- Export pivot option is available for the same purpose. o9 to provide training on this feature
- Optimize backend processing, batch updates, and frontend rendering to reduce grid update latency are possible areas of improvement. Propose a deep dive to evaluate the precise cause and solutions.
- The local planners should only have access to the data that they are responsible for - filters and data should be restricted. If this is not the case - configuration changes should be made. Global Planners need to use favourites and/or personal workflows. Provide training to users.
- The Platform team to create a collapsible side panel allowing users to temporarily hide country and product category details, enabling them to capture clean screenshots of monthly data and gain a comprehensive overview
Outcome & Metrics
- Streamlined workflows, reducing manual steps and duplicate efforts, with a 25–30% cut in forecast creation time.
- Improved platform usability, boosting user satisfaction scores from 6.8 to 8.5+/10.
- Enhanced cross-team collaboration, reducing clarification emails and meeting time for demand reviews.
- Increased forecast accuracy and reduced validation errors by 40% through better UI and process clarity.
- Drove a 20% rise in adoption of advanced forecasting features within the first quarter post-launch.

Lessons Learned
- Early alignment with WSA stakeholders avoided conflicting priorities between regional and global teams.
- Separating platform vs. product-related pain points helped clarify ownership for fixes between tech and business teams.
- Contextual observation of planners’ day-to-day work revealed dependencies (like last-minute sales inputs) that weren’t flagged in interviews.
- Mapping workflows end-to-end exposed inefficiencies that occurred outside the platform but still affected planning accuracy.
- Sharing quick-win recommendations during the research phase built trust and encouraged faster adoption.
- Documenting findings with visuals (journey maps, annotated screenshots) ensured continuity during the mid-project handover.
- Using user language rather than internal jargon made recommendations more relatable and easier for teams to act on.